Is there a way to calculate values in the Arrhenius equation without a graphing calculator?
My Chemistry professor never mentioned anything about using graphing apparatuses, so
Just part A
This video confuses me, not to mention that I don't own a TI-85. I have a TI-84 Plus
My Chemistry professor never mentioned anything about using graphing apparatuses, so
Just part A
This video confuses me, not to mention that I don't own a TI-85. I have a TI-84 Plus
1 Answer

Well, you can do it on Excel, or by hand... You may want to take a look at this 10-minute video I made, which teaches you how to use Excel for Chemistry:
DISCLAIMER: LONG ANSWER! Lots of images.
Let's try an example... consider the following reaction.
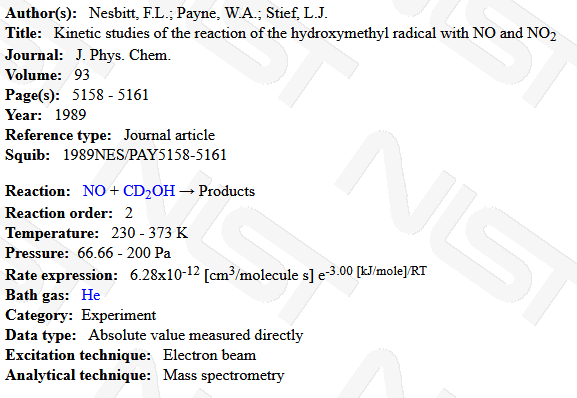
The straight-line version of the Arrhenius equation is:
#overbrace(ln k)^(y) = overbrace(-E_a/R)^(m) overbrace(1/T)^(x) + overbrace(ln A)^(b)#
METHOD 1
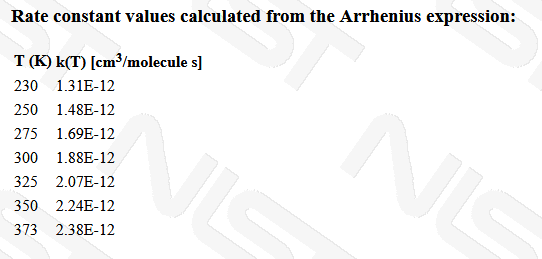
Since you know that the activation energy is a constant with respect to a small enough temperature range, this should be a straight line if you plot
Once you calculate
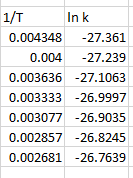
When doing it by hand, you could pick the first and last data points, as it is a straight line... in doing so, estimate the slope:
#=> "slope" = (Delta(lnk))/(Delta(1//T)) = (-26.7639 - (-27.361))/(0.002681 - 0.004348)#
#~~# #-"358.19 K"^(-1)#
The y-intercept will also be needed, and it is estimated by extrapolating back to
#-"358.19 K"^(-1) = (ln A - (-27.361))/(0 - 0.004348)#
#=> "y-intercept" = ln A = -25.804#
From here we should compare to the straight-line version of the Arrhenius equation:
#ln k = -E_a/R 1/T + ln A#
The slope then allows us to find the activation energy:
#color(blue)(E_a) = -R cdot "slope"#
#= -8.314 cancel"J""/mol"cdotcancel"K" xx ("1 kJ")/(1000 cancel"J") xx -358.19 cancel("K"^(-1))#
#=# #color(blue)("2.98 kJ/mol")#
The y-intercept allows us to find the frequency factor:
#color(blue)(A) = e^("y-intercept")#
#= e^(-25.800)#
#= color(blue)(6.24 xx 10^(-12) "cm"^3"/molecule"cdot"s")# or perhaps in units we are more familiar with... this is equal to
#3.76 xx 10^9 "M"^(-1)cdot"s"^(-1)# .
METHOD 2
Or, if you aren't that visual... on Excel, simply set up data columns like this:
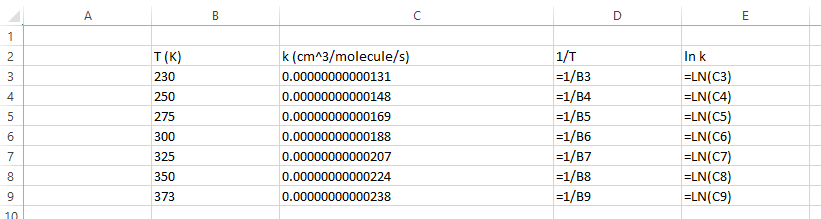
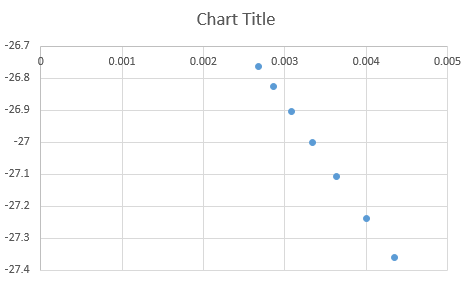
Then select D3 through E9 and go to Insert > Recommended Charts > All Charts > X Y (Scatter).
You should get this:
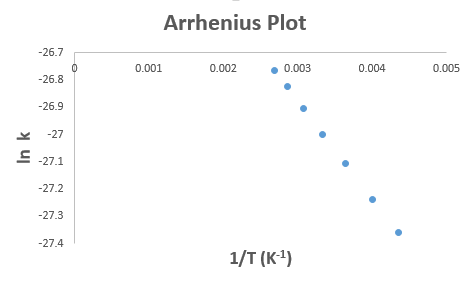
With a little bit of formatting, you could get this:
And by right-clicking on the data point, go to Add Trendline, then scroll down to find and click "Display equation on chart" and "Display R-squared value on chart".
What you should end up with is:
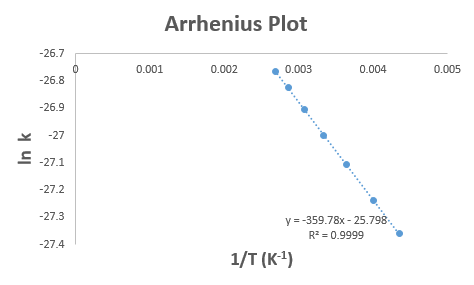
From this we should again compare to the straight-line version of the Arrhenius equation:
#ln k = -E_a/R 1/T + ln A#
From this, the example slope is
#-E_a/R = -"359.78 K"^(-1)#
and the example y-intercept is
#ln A = -25.798#
Therefore, the activation energy is:
#color(blue)(E_a) = -R cdot "slope"#
#= -8.314 cancel"J""/mol"cdotcancel"K" xx ("1 kJ")/(1000 cancel"J") xx -359.78 cancel("K"^(-1))#
#=# #color(blue)("2.99 kJ/mol")#
and the frequency factor is:
#color(blue)(A) = e^("y-intercept")#
#= e^(-25.798)#
#= color(blue)(6.25 xx 10^(-12) "cm"^3"/molecule"cdot"s")# or perhaps in units we are more familiar with... this is equal to
#3.77 xx 10^9 "M"^(-1)cdot"s"^(-1)# .
We more-or-less got the same thing either way, so both ways work.
