How does a symmetric probability density relate to a molecular bonding orbital in hydrogen atom and its bonding potential energy curve? Is there such a thing as an antibonding potential energy curve?
1 Answer
You mean hydrogen molecule? You may be familiar with this curve...
But this is only the bonding curve. You may not have been shown the antibonding curve, because, well, it's not important to bonding in
Well, the entire wave function for an electronic system, i.e. molecules, etc., must be antisymmetric, as per the rules of fermion statistics.
It consists of a spatial part and a spin part:
#Psi (1,2) = psi_("spat")phi_"spin"# where
#Psi(1,2)# indicates a two-electron wave function consisting of the spatial part#psi_"spat"# and the spin part#phi_"spin"# . The numbers indicate each electron.
In
#ul(uarr darr)#
so swapping of the particles leads to a negative sign, i.e.
#phi_"spin"(1,2) = -phi_"spin"(2,1)# .
#alpha(1)beta(2) - beta(1)alpha(2) = -[alpha(2)beta(1) - beta(2)alpha(1)]# where
#alpha# means spin up and#beta# means spin down.
An antisymmetric function times a symmetric function gives an antisymmetric function as required.
So, the spatial part must be symmetric with respect to particle interchange, i.e.
#psi_"spat"(1,2) = psi_"spat"(2,1)# .
A graph of the spatial part is symmetric, which in this diagram is called

These graphs represent the spatial densities of the electrons, and the peaks correspond to the maximum electron density of the
If you don't recognize it, this is another way to graph it (

The above pink graphs of
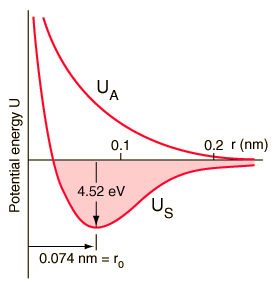
The potential energy curve that corresponds to these orbital overlaps looks like this:

The antibonding curve is given by
As you can see, the bonding curve has that dip, a potential energy minimum, as required. The antibonding curve does not, and it should make sense because antibonding is... well... against bonding!


